Visualization of Facebook* User Activity
Unfortunately for social network merchants, Facebook* has quite limited possibilities for analyzing the activities of Facebook* Groups and Pages.
Administrators of Facebook* groups complained about how hard it was to test and predict the sale of advertising on Facebook* because Facebook* hides its algorithm of advertising. This leads administrators to analyze advertisement results manually. They continuously download raw data from Facebook*, compare it to previous datasets and analyze all data in Excel.
A client asked Byndyusoft to create a tool for social network merchants through which they could analyze Facebook* activities by automatically generated reports.
Byndyusoft started by brainstorming each client’s idea. As a result, we created a list of analyzed customer’s objectives and complaints. This list was used as a main vector for creating a solution.
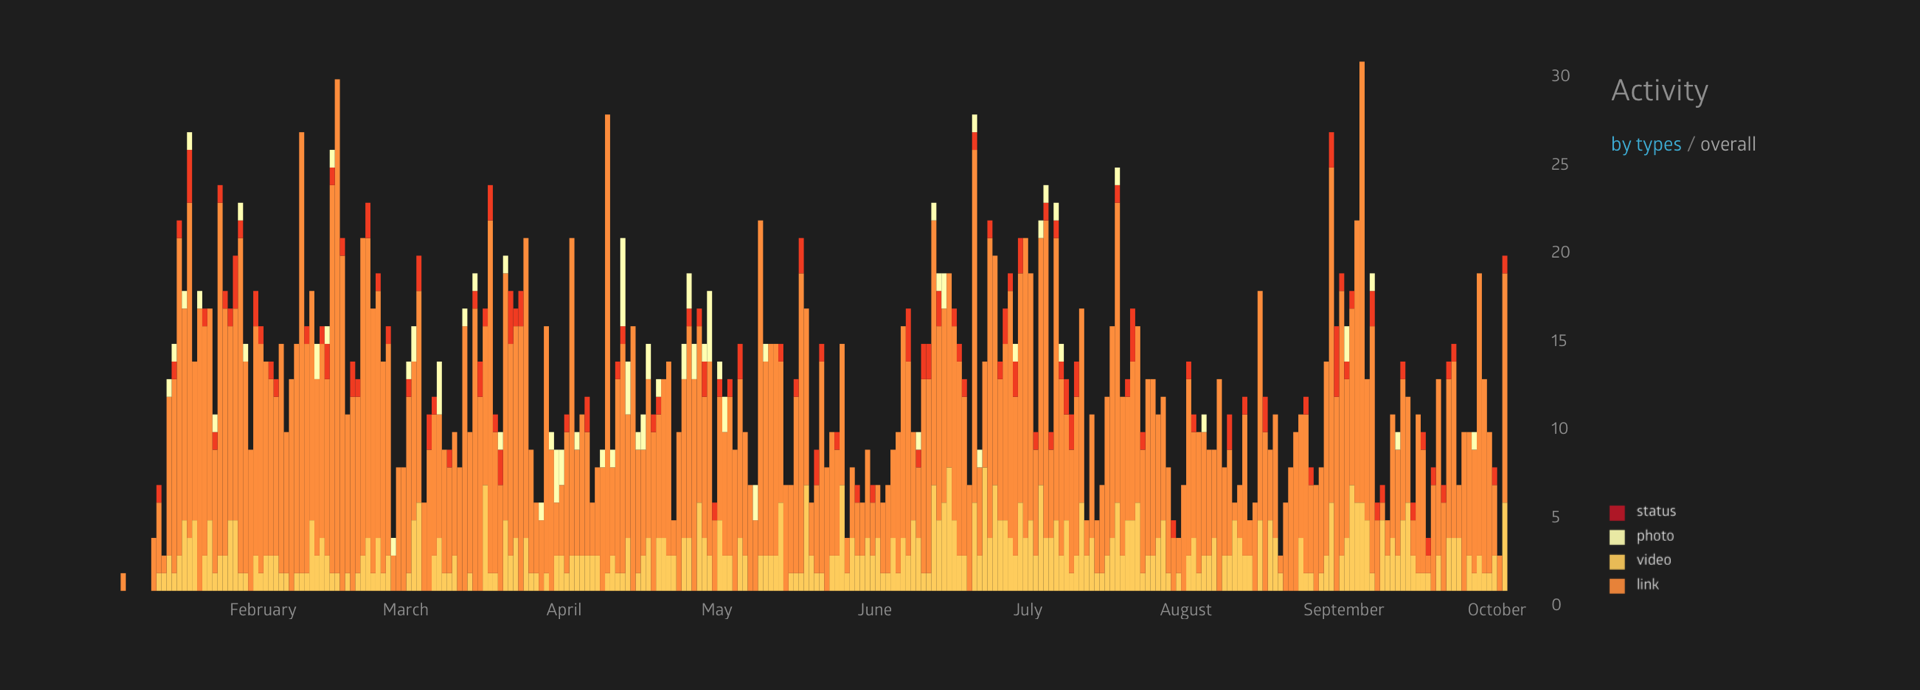
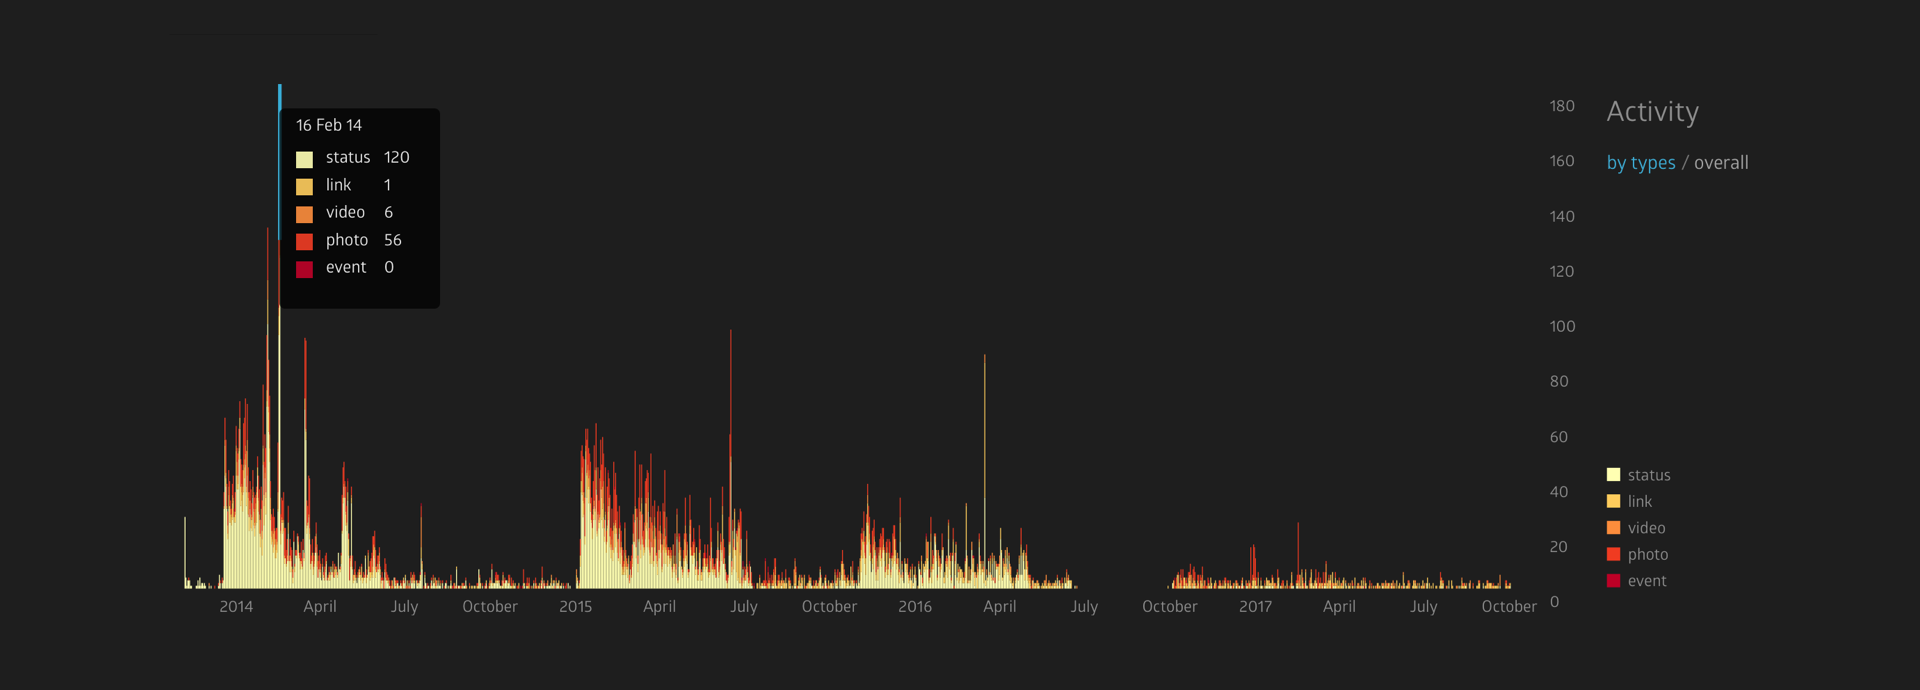
Byndyusoft designed and developed a solution — interactive graphs and data tables for analysing the quality of the content. An activity graph shows when and which type of the content meets the highest public response and gives ideas for future content development.
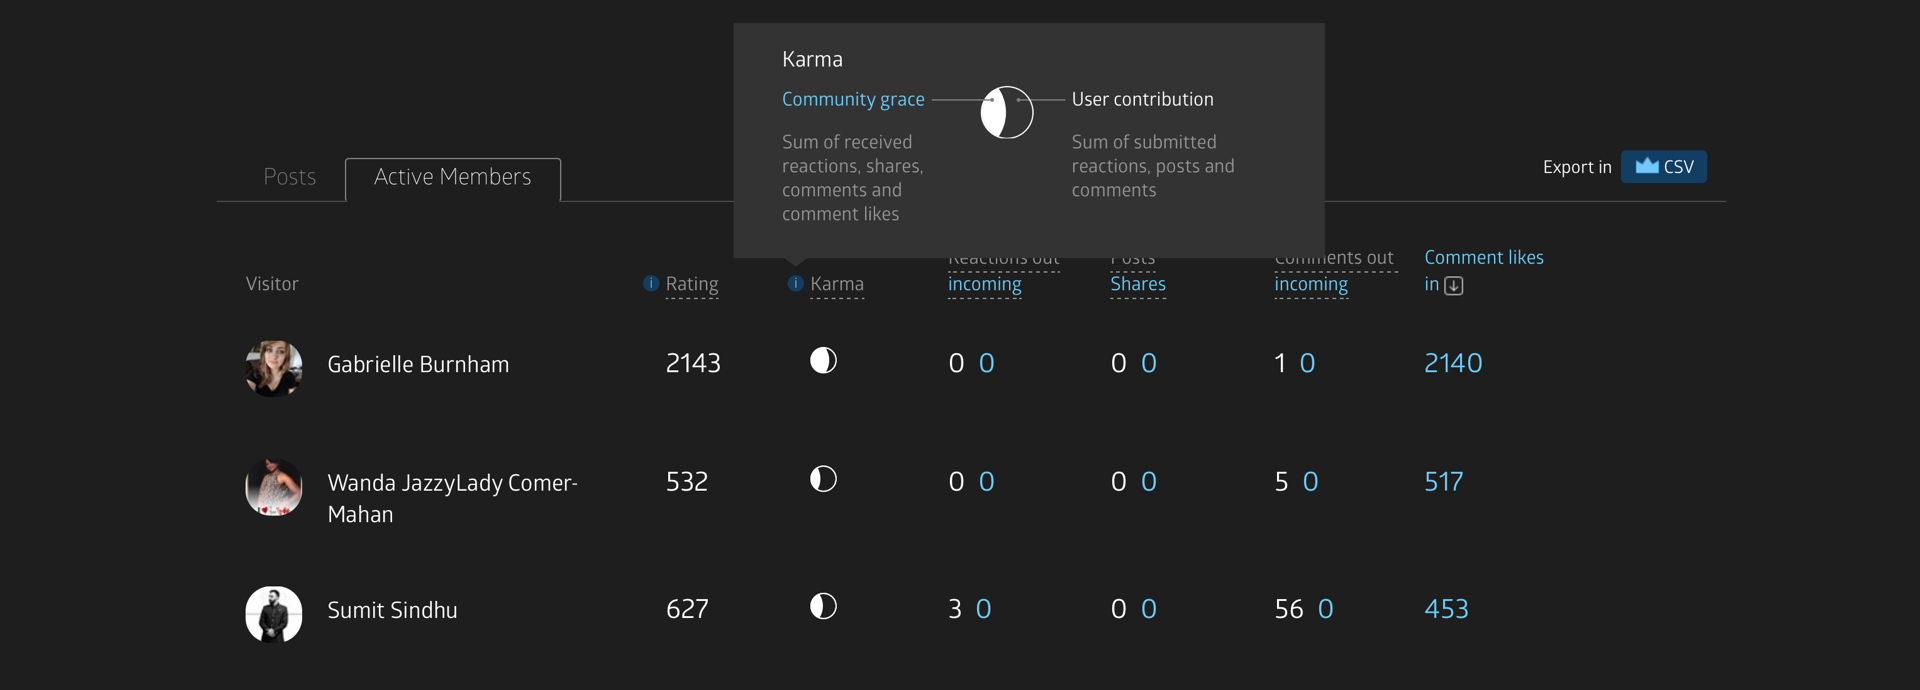
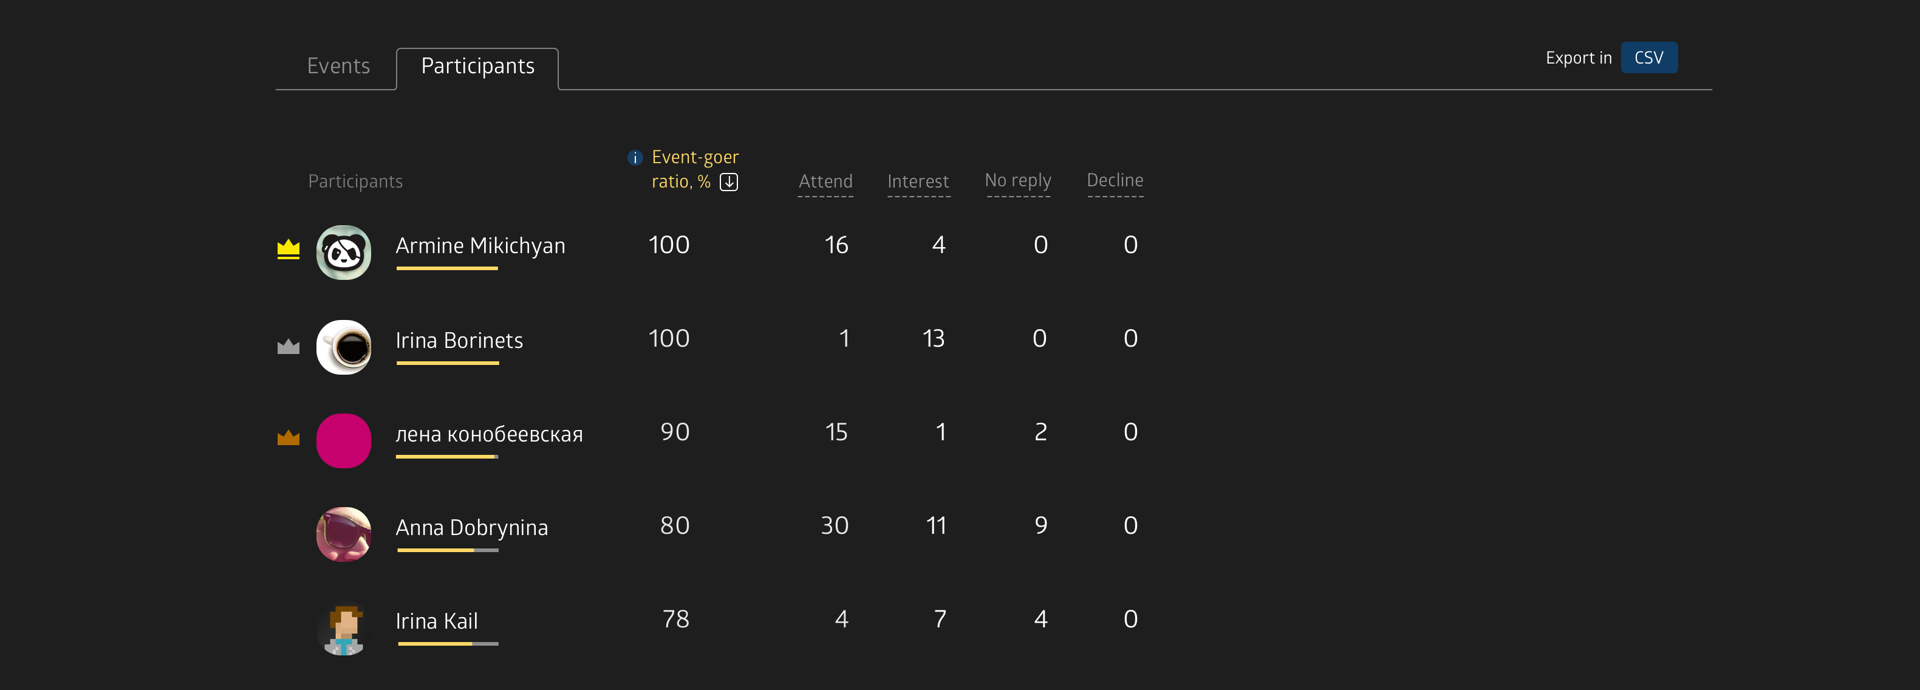
We invented special ‘karma’ and ‘event-goer’ heuristics for helping to arrange online and offline activity of group members.

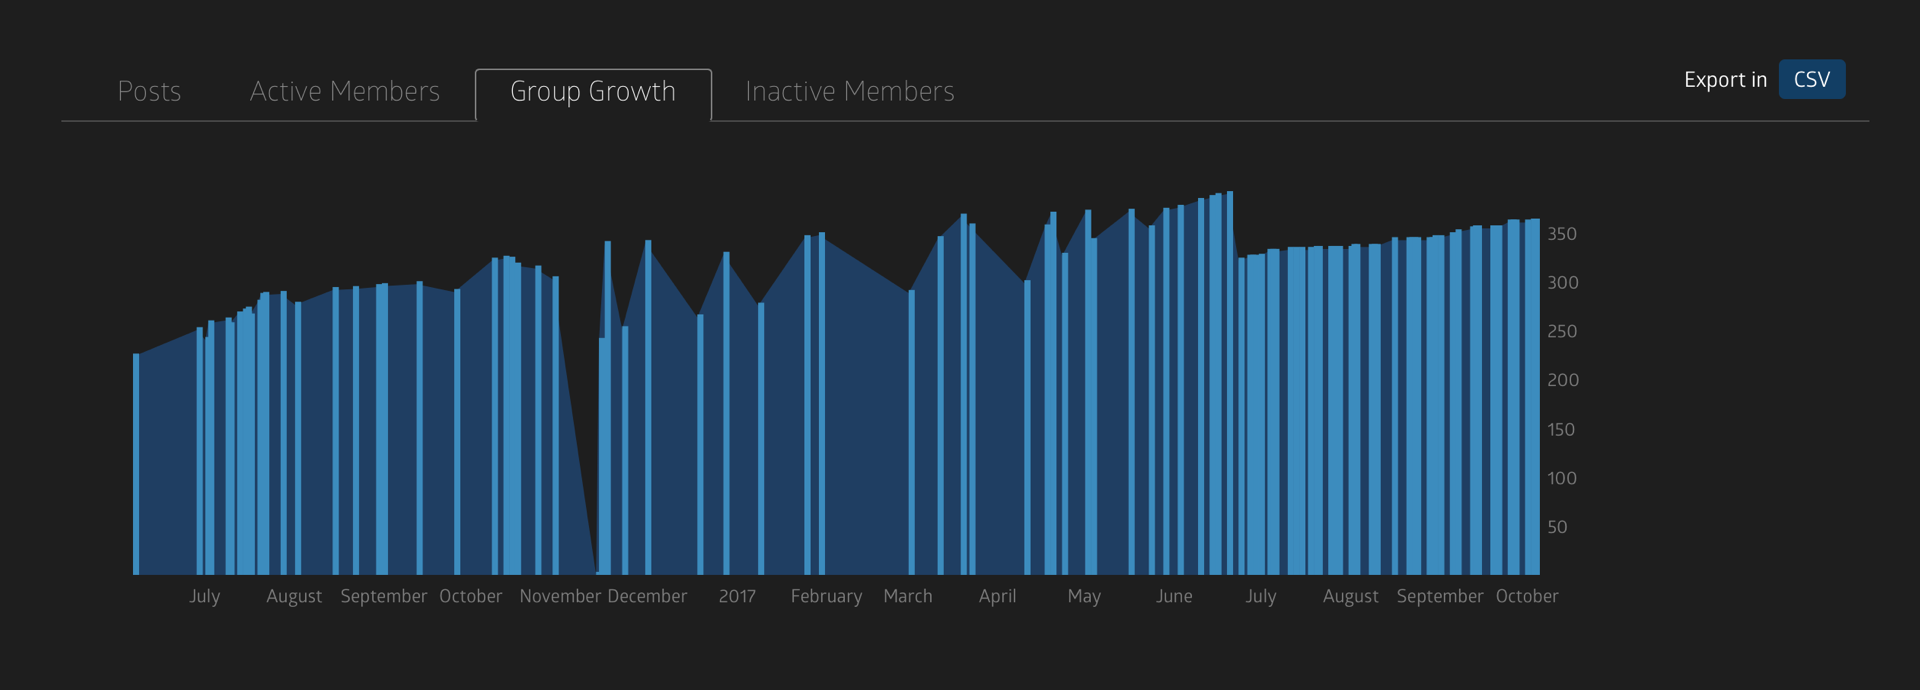
A developed product Sociograph.io helping to keep an active and useful social network audience into a Facebook* group. For instance, group administrators can use the analytics information to exclude inactive group members, which increases marketing indicators.
Sociograph.io became a paid service six months after it started.